Monday, December 12, 2016

Reading SAS files from Power BI using R Script

Recently I have been working to read SAS files (sas7bdat file format) in Power BI. SAS technical support and the Power BI community team have both worked with me to attempt to use the SAS Local Provider for OLE DB which is the only provider that does not require a SAS server.

We were able to use the SAS Local Data Provider 9.44 in Excel by using the Data Connection Wizard to access Data Link Properties and to read the sas7bdat data into Excel as a data source (see details on this at the bottom of this post).

However, following similar steps in Power BI lead to an error message because "the SAS Local Provider for OLE DB does not 'like' the GetOleDbSchemaTable method. (quote from SAS Technical support):
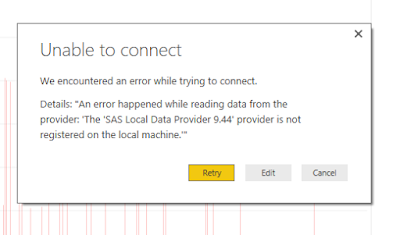
(Text of error: "The 'SAS Local Data Provider 9.44' provider is not registered on the local machine.")
Error Message
Text of error: "The 'SAS Local Data Provider 9.44' provider is not registered on the local machine."
Now, this error seems actionable until you remember that we just used the provider to connect from Excel. This is due to the use of the GetOleDbSchemaTable method and we could not find a way to work around this problem in Power BI.

I have submitted this as a support ticket to Microsof and I look forward to their response on how to get a supported connection to SAS files.

The next step is to find another way:
Loading Data into the Dashboard file using R Script:

The best method I have found so far to read SAS files into Power BI is using R script:
https://businessintelligist.com/2016/09/09/reading-sas-sas7bdat-files-in-power-bi/

1) Locate your SAS Data set files (you can download a sample set in ZIP format from: http://www.principlesofeconometrics.com/sas.htm)

2) Install R locally (I have been using R 3.3.2 from CRAN (https://cran.r-project.org/bin/windows/base/)

3) Install Power BI Desktop locally:
Download Power BI Desktop from http://app.powerbi.com

4) Open Power BI, and first, set your version of R in Options and Settings:
a. Click the “x” in the upper right corner of the splash dialog box to close it:
Close the Power BI Desktop dialog box
b.       Select File -> Options and Settings ->Options -> R Scripting
c.       You should be able to select your installed R version from the Detected R home directories list and Detected R IDEs
5) Now, setup the data source for your Power BI solution:
a.       Drop down Get Data and select More… -> Other –> R Script, then the Connect button
b.       The Execute R Script dialog box provides an input location for the following script which will set the working directory, access the library and read the file into Power BI:


c.       Click OK to see the content of the SAS file, select the table(s) to load  (multiple table files haven’t been tested by me using R Script)
d.       Select to Load the data directly, or Edit to use the Query Editor to filter, clean, reformat or otherwise transform the data for this and all future data loads.

6)      Click Close & Apply when the data set is complete and you are ready to use it in Power BI
 
Graph using Airline data from SAS file


Using a faster library:
I have found some information that haven is a faster library than sas7bdat, the sample files for SAS that I have access to are not sufficient to test this, but the haven library works very well:

Using haven the script changes to reference the haven library (https://cran.r-project.org/package=haven) and to use the read_sas function to read the SAS file from that library as you can see in this sample to read another data file, USA:
I am very interested to know what the results are using production size and complex datasets, and am willing to help in anyway that I can if you have questions about using this method.

Publishing and Refresh of data:
The Power BI solution can be published to http://app.Powerbi.com using the Publish button. The R Script has imported the dataset, so that will be published to the Power BI Service along with the reports.

R Script as a data source does not yet support refresh. There is a setting for refreshing data from Files, but that does not work for R Script as a source, it is for CSV, etc…


Rachael

Tuesday, October 11, 2016

Azure Cloud Based Analytics

The elements of analytics are the same whether on premises or in the cloud. Cloud based tools for analytics can provide a platform that is far more extensible, economical and powerful than traditional on-premise. This session will review some cloud analytics use cases and how the tools from Microsoft combine to create business insight and value.
Azure Cloud Tools
Microsoft Intelligence (edited, previously Cortana Intelligence Suite) is a powerful combination of cloud based tools that manage data, provide analysis capability and store or visualize results. Together these tools represent the six elements of data analytics.


The talk on Data Based analytics includes a demonstration of Data Lake, PolyBase, Azure SQL Data Warehouse, Power BI, and Azure Machine Learning. The links to Power BI and Azure ML will take you to the apps, each has a free account you can sign up and use for testing. I encourage you to sign up for the free offer for $200 in Azure Credits (United States based offer, at the time of this posting Oct. 11, 2016).

Analytics projects
According to Gartner analytics projects include 6 elements and there are common challenges for each of these elements that must be addressed in any analytics project:

  1. Data sources - volume alone and the need to move large data sets
  2. Data models - complexity of setup as they simulate business processes
  3. Processing applications - data cleansing, remediation of bad data
  4. Computing power - analysis requires considerable power
  5. Analytics models - design of experiments and management of the models, model complexity
  6. Sharing and storage of results - informative visualizations and results embedded in applications

Tools provided by cloud vendors provide assistance and in some cases, with far superior solutions to these issues.
The Cloud analytics tools are designed to address the challenges we’ve been discussing:
 1) Scalability: Agility/ Flexibility
     -large data sources –power them off when not in use
     - heavy computing capability – pay only for what you use
    - Stand up a new environment – pilot a new capability
   - integrate data sources with multiple visualization and analytics environment
2) Economy –
    - less expensive to stand up than hardware and software,
    - fewer skills necessary in house for implementation, configuration, integration, use,
     - management and maintenance of systems
3) Security
   - Azure is designed for security from the ground up
   - Microsoft spends $1B a year on security research – more than most security firms
   - identity based security throughout the stack

   - protection for disaster recovery, regulatory specific platforms to address security needs
4) Capability
  - Integration with desktop tools for embedding visualizations, integrating predictive analytics
  - Consumer technology style interfaces enable faster learning and require fewer skills than script based on premises tools
  - Collaboration enabled by ties across Office 365 tools and Mobile capabilities
  - Powerful servers can simply process far more data and analysis than most local servers

How can my business benefit from analytics in the cloud?
Data, provided and used as a valuable asset of the firm provides leverage employees apply to problem solving activities. Fact based trend prediction leads to insights that provide business value.
Businesses taking advantage of the cloud to benefit from increased cloud computing power, the ability to handle large data sets and for the mobility provided by access to the analytics platform from any location.


Other articles that may help to answer this question are:

Power BI is a great starting point for moving analytics to the cloud
Power BI brings many customers their first exposure to cloud analytics. Companies find multiple benefits of collaboration between users, mobile access, and the experience of adopting a new way to use data. Workspaces provide secure areas to work together on Power BI solutions and are linked to Exchange groups and OneDrive folders where other collateral can be shared.

Storage in the cloud 
Using Azure cloud based storage is relatively inexpensive, remotely accessible from anywhere, secure and in coming data is free (data moving out of your region is charged). Large data sets can be managed in Azure Blob Storage, Azure Data Lake, Azure SQL DW and Azure SQL Database.

Predictive Analytics with Azure Machine Learning
Azure ML provides a friendly tool for building machine learning experiments, cleaning and visualizing data. The environment provides familiar analytic tools for R and Python scripting, built in models for statistical analysis and a process for encapsulating trained models in web services as predictive experiments. Integration with Excel and other applications is simplified by the web service interface.

Questions:
Q1) In the PolyBase example does modeling the data by casting columns hinder performance of the data load in the "Create Table As" (CTAS) statement?
(Original posting left this question unanswered, edited to add the answer below)
In creating the External Table the columns must be of the same data type.

However, when querying the external table to use CTAS to populate a SQL DW table I found that using cast to change the datatype of the column was faster to complete the new table creation. This was true for two cases, one where I converted in the input column varchar2(20) to an Int and another where I converted the input varchar(100) to a Date data type. I suspect this is due to the increased speed of input for Int and Date data types over varchars, but it indicates that the original query time isn't different.


Q2) Is it simple to switch from cold to hot in Azure Blob Storage?

The Azure hot storage tier is optimized for storing data that is accessed frequently. The Azure cool storage tier is optimized for storing data that is infrequently accessed and long-lived. - Microsoft documentation 
In regions where these settings have been enabled (not East yet), they can be changed in the Configuration blade of the Storage Account.

Q3) When to use Data Lake in comparison to Blob Storage.

In the demo for this talk I read the NYC 2013 Taxi data from the 12 - 2+GB CSV files into Azure SQL DW using CTAS. At this time, Data Lake is still in preview, and we cannot yet use CTAS with Azure Data Lake. This forced me to use Azure Blob Storage.
Additoinal differences are that Data Lake is optimized for parallel analytics workloads and for high throughput and IOPS. Where Blob Storage is not optimized for analytics but is designed to hold any type of file. Data Lake will hold unlimited data and Blob Storage is limited to 500TB. There are cost differences too, I recommend the Azure Pricing Calculator.

I recommend the Microsoft article Comparing Azure Data Lake Store and Azure Blob Storage for details.

Wednesday, September 28, 2016

Performance Tips and Techniques for Power BI and Power Query (update)

Power BI Performance Tips and Techniques update:

Back in March of this year I created an article and a webinar for the Pragmatic Works Blog.

The original concepts still hold, Power BI and Excel Power Query are very powerful tools for building data models and sharing data discovery and visualizations. As you move from initial prototyping to a more mature model you may find that performance can be bogged down if you don't manage the structure of your reporting information. This talk provides Tips and Techniques to manage this information (link to updated slides).


Since the original webinar I have presented this topic at a few user groups and SQL Saturdays and was asked some very good questions.

I'd like to answer these questions here, and to update the slide deck as well.


1) In Providence at the BI User Group I was asked: What happens in Kasper de Jonge's Memory Usage Tool macro when there is a join between two queries loaded into the model?


If the join is done in the data load, the data model contains only one table, as in the example discussed in the original presentation.

If there is a relationship created between two tables loaded in to memory, the joined tables are both shown in the pivot tables that result from the macro, and how much memory taken by each column is shown as a datatype and total for the column.

2) In NYC at the Power BI User Group a member asked: Does the HierarchySlicer cause performance problems?
To test this, I used a data table with nearly 14M rows linked to a Date table. Power BI connected via direct query to SQL Server 2016. 


The Hierarchy Slicer (HierarchySlicer.0.7.9.pbiviz) at Year / Month on the Date table compared to a "flat" YearMonthName non hierarchical slicer. In this case, each new slicer selection took about 2 seconds to repopulate the summary table to the left. The two took the same amount of time, I did not see a difference in performance.

3) At SQL Saturday in Dallas this question came up: Is the SSAS formula engine still single threaded in Power BI on the portal as it is on the desktop? The SSAS engine is the same in Power BI on app.powerBI.com as it is on your local drive. There would not be an improvement on calculations caused by multi-threading, although the local machine may or may not have more resources to dedicate to the formula engine thread.

Thank you all for the great questions, please comment on others questions or if you have more information!

Friday, July 8, 2016

World Class Data Organizations and SQL Server 2016


World Class Data Organizations (WCDO) intentionally invest in and build their data cultures to create business value. These businesses integrate data into daily activities beyond report or dashboard reviews. Employees know what data elements represent, how to access them, and how to use them to create new insights.


WCDO and SQL Server 2016 (pdf) presents the primary characteristics and activities of WCDO's and expands on some of the features of SQL Server 2016 designed to enable those activities.

This is the slide deck presented on June 30, 2016, and the beginning of a series of presentations I will deliver on this topic.

Saturday, June 11, 2016

Power BI Best Practices - Tactics

I've been asked to present Power BI best practices to a client on Monday. This two post series is part reference to great articles and partly my own insights on the topic, some gained by painful experience. Part one addresses BI project strategy, and this is part two on tactics:

#1 Dashboards are "a single place to monitor the current state of the data".
Microsoft support has tips for great dashboards and points out some design techniques that are important to keep in mind:
#2 Design  for the user's reporting needs.
Like Delora Bradish's exhortation to always consider reporting when designing your data warehouse, your data model should provide friendly table and column names that reflect familiar business terms well understood by the system's users.

Include only necessary data and hide any information that might be used for creating the data model or calculations but not shown (like key values) in reports.

#3 Design your data model to support self-service.
From Marco Russo we are guided to take advantage of data views to stabilize our data loading process:
  • Use views for your data sources to avoid dependence on table structures
  • Create a view schema in the database that consists only of the views for each table to be imported
  • Each view should only contain the columns necessary for reporting from the data model
  • Use meaningful names that will make sense to your users
Double check relationships in your data model to ensure that self service reporting will return valid data.

Carefully specify check data types and how or whether fields should be summarized.

Separate unrelated data into multiple tables to clarify reporting.

Use star schema when possible, as snowflakes can limit scalability. Use snowflakes when lookup tables can provide usability improvements without performance implications.

#4 Consider security and data refresh early in the design of your project.
Work with appropriate administrators, whether in Security or your DBA's, to build gateways for data refresh or direct query access from on premises data sources to the Power BI portal.

Schedule refreshes to correspond with your data frequency, there is no reason to update data eight times a day if it is loaded weekly.

#5 Take advantage of Power BI Content Packs internally and to access services.
Use organizational Content Packs to provide read-only pre-built solutions to your organization or other groups. Members of the group can copy these and personalize them as needed.

Use Content Packs for services published for many common business services. Use this link to see available content packs from the Power BI portal.

#6 Configure your solution to maximize Q&A Natural Language capabilities.
Chuck Schaeffer's CRM Search article provides considerable information about designing for Q&A:

  • "Datasets not represented with tiles are not considered, anticipate the types of question that may be asked and design the dashboard with tiles from datasets which may respond to sure questions".
  • Questions will join entities to provide answers (example sales and fiscal calendar to answer a question about "Last year's sales revenue").
  • Be sure to fix data types so that Q&A can correctly represent the answers.
  • Be sure to mark those that should not be aggregated with do not summarize.
  • Add data categories wherever possible.
  • Put your topics in their own datasets, break out each topic from a given entity.
  • Add synonyms to improve Natural Language capabilities of PBI on your data set.

#7 Be wary of performance issues that might affect your data model's performance.
These are a few tips from my blog entry on Pragmatic Work's site:
Tall, narrow tables are faster than wide tables with many columns, especially if the columns are highly unique (columns that are highly unique are said to exhibit "high cardinality").

Use integer keys for primary/foreign key relationships.

Reduce uniqueness in columns by splitting date and time values, and by reducing the "granularity" of time to hours if that is required for reporting.

Include only relevant data in the data model. One powerful example is not to include unnecessary dates in your Date

Please comment on my choices, or add your own best practices to this growing list.

The first post in this short series addresses strategic concerns for developing BI projects.

Power BI Best Practices - Strategy

I've been asked to present Power BI best practices to a client on Monday. This two post series is part reference to great articles and partly my own insights on the topic, some gained by painful experience. Part one, below, addresses BI project strategy and part two covers tactics:

#1 Find a significant business need and address it.
To start out using best practices it is wise to begin with the operating environment. The Business.
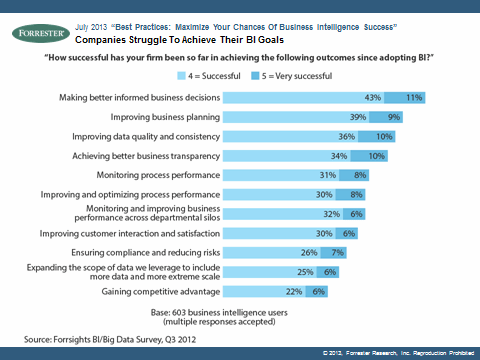
 Your BI solution is a system designed to address a business need, it is not a stand alone project. The opportunities for BI solutions are numerous. The ComputerWorld Weekly article by Forrester in August of 2013 shows a chart that categorizes business needs from BI. This chart also shows that many, if not most BI programs miss on these outcomes. Don't forget to address these objectives as you design, build and implement your solutions.

Forrester BI best practice chart

#2 Address the business opportunity where BI can make the most impact with the least delay.
Find the need, then partner closely with sponsors, other stakeholders, and most closely with those who will use your system, to define and deliver success. Without these three levels of buy-in throughout the project you are at significant risk of delivering a product that doesn't fulfill expectations.

Identify data sources and their availability to determine feasibility of this project. If there are significant challenges in data gathering or validation for this project - identify them, determine responsible parties in the business to resolve the issues (use your company's Data Governance organization or create one) and then either find other data or find other opportunities. Do not get bogged down by data issues, this can kill a BI project.

#3 Iterate to quickly deliver solutions to the business. 
Every week that you wait to deliver as you perfect or add features to the BI solution is a week that the business doesn't have visibility to their information. Produce the minimum viable product, test it thoroughly and validate the results, then get it to your business partners. Their feedback on the "incomplete" product will be invaluable as you continue to develop your solution and they will quickly benefit from your hard work.

#4 Find a BI tool that best supports the business need, then design a solution that supports users.
A 2014 article on CIO.com "9 Common BI Software Mistakes" calls out selecting a tool in isolation as one of the worst BI mistakes. Invest your time and money in a tool that will fit business requirements, work with the business to validate your selection. The overriding objective of any BI solution is to deliver a system that users find helpful. Then, build your solution with the user in mind.

Do you have other strategic concerns that must be addressed when beginning BI projects? Please comment or share your thoughts.

The next post in this short series addresses tactical issues related to the development of a specific BI solution.

Wednesday, June 8, 2016

Power BI on Premises and Pyramid Analytics

Power BI is a great tool and more than a few BI managers have told me that this tool has changed the way that they think about their BI environment. Unfortunately some of those managers also admit that they can't use it because their data cannot leave their network. I know that there is a whole conversation that we need to have about security, but for now, let's leave that aside and respect the customer's need to publish Power BI on premises.

My customers are delighted to that there is a solution coming from Microsoft in SQL Server Reporting Services. The May announcements from Pyramid Analytics and Microsoft provided much hoped for news! The twist is that this current solution has been created by another reporting platform and that causes many questions. To the customer there are two systems already: Microsoft SQL Server reporting stack SSRS and Power BI, with the on premises solution adding the third: Pyramid Analytics.

The information below may help you to decide whether Pyramid Analytic's BI Office is the right choice to get Power BI deployed inside your network.

Kudos must go out to Pyramid Analytics for building a great solution that really solves a problem for many customers!

Images from the Pyramid Analytics video: Best-in-Class On-Premise Business Intelligence for Power BI from Pyramid Analytics
Microsoft and Pyramid Better Together
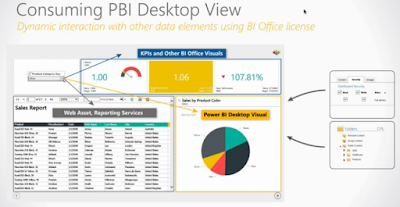
Conceptual slide, describing context for combing the systems.

Pyramid BI Office Storyboard with active embedded Power BI visualization
Image of a Pyramid BI Office Storyboard with a slicer affecting all visualizations.

This video posted by Pyramid Analytics shows the integration, not only to securely host the Power BI solution, but to integrate Power BI visualizations in to a Pyramid Storyboard (link).

This video is a one hour interview of Jen Underwood, Impact Analytics and Peter Sprague, VP Product Marketing , Pyramid Analytics discussing this very topic and reviewing the capabilities of Pyramid's BI Office (link).

Announcement in the May update feature summary (link).