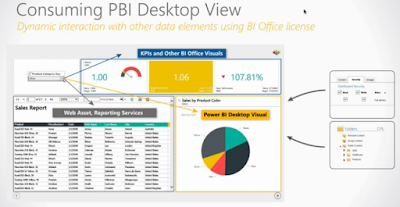
#1 Dashboards are "a single place to monitor the current state of the data".
Microsoft support has tips for great dashboards and points out some design techniques that are important to keep in mind:
- Readers will drill down for detailed information, the dashboard should provide high level information, showing what performance indicators require the user's attention.
- Make the most important information the biggest on the page and provide context, including units. For example: show a KPI visual with trend and current value.
- Put the most important items in the upper corner where your users will start reading.
- Consider the visualization and select those that tell the story in the data.
- The Microsoft support article includes a great group of references on design including writings of Stephen Few and Edward Tufte.
- Dustin Ryan points out a nice technique of using visualization elements as navigation (at time 47:23 in the video) as they interact with other visuals in a report.
Like Delora Bradish's exhortation to always consider reporting when designing your data warehouse, your data model should provide friendly table and column names that reflect familiar business terms well understood by the system's users.
Include only necessary data and hide any information that might be used for creating the data model or calculations but not shown (like key values) in reports.
#3 Design your data model to support self-service.
From Marco Russo we are guided to take advantage of data views to stabilize our data loading process:
- Use views for your data sources to avoid dependence on table structures
- Create a view schema in the database that consists only of the views for each table to be imported
- Each view should only contain the columns necessary for reporting from the data model
- Use meaningful names that will make sense to your users
Carefully specify check data types and how or whether fields should be summarized.
Separate unrelated data into multiple tables to clarify reporting.
Use star schema when possible, as snowflakes can limit scalability. Use snowflakes when lookup tables can provide usability improvements without performance implications.
#4 Consider security and data refresh early in the design of your project.
Work with appropriate administrators, whether in Security or your DBA's, to build gateways for data refresh or direct query access from on premises data sources to the Power BI portal.
Schedule refreshes to correspond with your data frequency, there is no reason to update data eight times a day if it is loaded weekly.
#5 Take advantage of Power BI Content Packs internally and to access services.
Use organizational Content Packs to provide read-only pre-built solutions to your organization or other groups. Members of the group can copy these and personalize them as needed.
Use Content Packs for services published for many common business services. Use this link to see available content packs from the Power BI portal.
#6 Configure your solution to maximize Q&A Natural Language capabilities.
Chuck Schaeffer's CRM Search article provides considerable information about designing for Q&A:
- "Datasets not represented with tiles are not considered, anticipate the types of question that may be asked and design the dashboard with tiles from datasets which may respond to sure questions".
- Questions will join entities to provide answers (example sales and fiscal calendar to answer a question about "Last year's sales revenue").
- Be sure to fix data types so that Q&A can correctly represent the answers.
- Be sure to mark those that should not be aggregated with do not summarize.
- Add data categories wherever possible.
- Put your topics in their own datasets, break out each topic from a given entity.
- Add synonyms to improve Natural Language capabilities of PBI on your data set.
#7 Be wary of performance issues that might affect your data model's performance.
These are a few tips from my blog entry on Pragmatic Work's site:
Tall, narrow tables are faster than wide tables with many columns, especially if the columns are highly unique (columns that are highly unique are said to exhibit "high cardinality").
Use integer keys for primary/foreign key relationships.
Reduce uniqueness in columns by splitting date and time values, and by reducing the "granularity" of time to hours if that is required for reporting.
Include only relevant data in the data model. One powerful example is not to include unnecessary dates in your Date
Please comment on my choices, or add your own best practices to this growing list.
The first post in this short series addresses strategic concerns for developing BI projects.


